Direction des Statistiques agricoles, de l’Informatique et de la Documentation
|
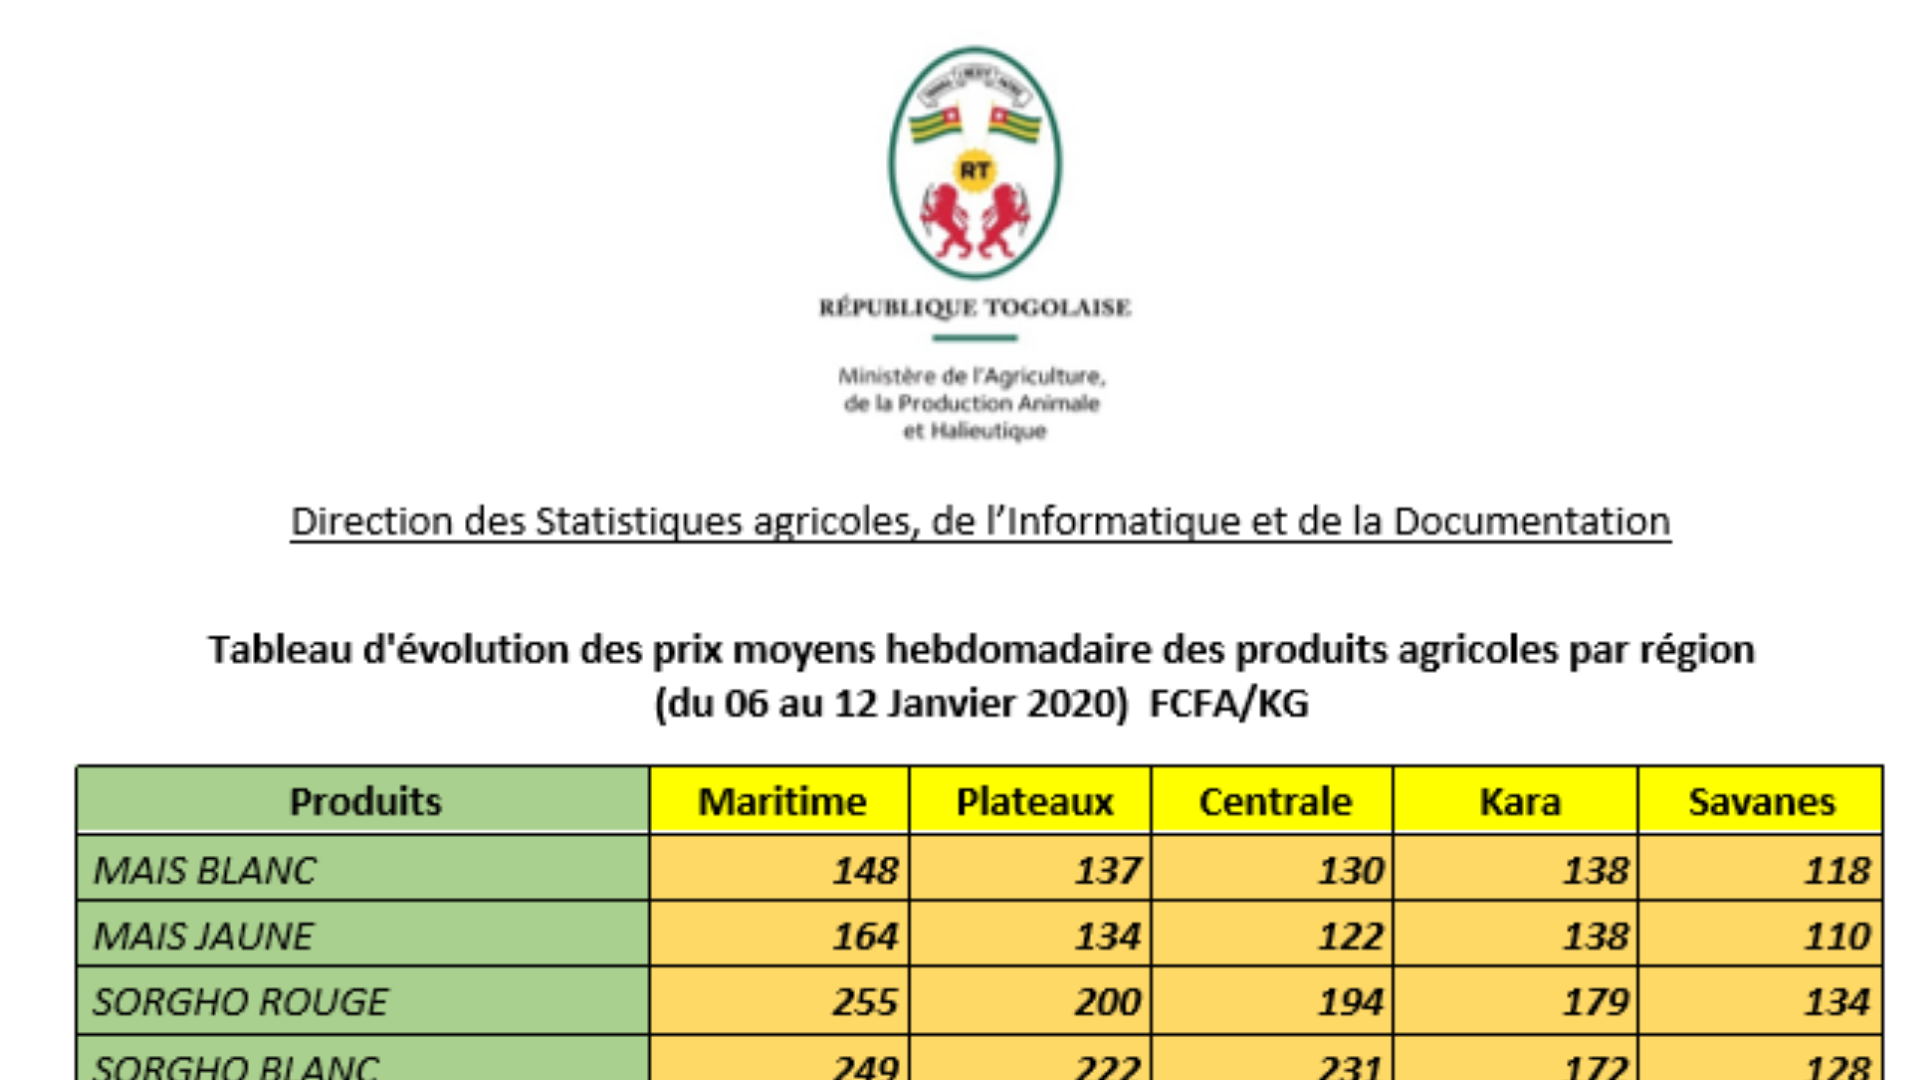
Tableau d'évolution des prix moyens hebdomadaire des produits agricoles par région (du 06 au 12 Janvier 2020) FCFA/KG |
||||||
|
Produits |
Maritime |
Plateaux |
Centrale |
Kara |
Savanes |
|
|
MAIS BLANC |
148 |
137 |
130 |
138 |
118 |
|
|
MAIS JAUNE |
164 |
134 |
122 |
138 |
110 |
|
|
SORGHO ROUGE |
255 |
200 |
194 |
179 |
134 |
|
|
SORGHO BLANC |
249 |
222 |
231 |
172 |
128 |
|
|
MIL |
285 |
438 |
333 |
223 |
187 |
|
|
RIZ PADDY |
125 |
185 |
143 |
137 |
145 |
|
|
RIZ ETUVE |
350 |
315 |
286 |
333 |
275 |
|
|
RIZ DECORTIQUE LOCAL |
392 |
323 |
339 |
348 |
305 |
|
|
FONIO |
739 |
751 |
458 |
450 |
|
|
|
HARICOT BLANC |
206 |
186 |
189 |
251 |
218 |
|
|
HARICOT ROUGE |
320 |
249 |
250 |
200 |
|
|
|
ARACHIDE GROSSE GRAINE |
712 |
650 |
588 |
558 |
506 |
|
|
RACHIDE PETITE GRAINE |
683 |
630 |
583 |
614 |
604 |
|
|
SOJA |
271 |
231 |
221 |
218 |
244 |
|
|
Gari |
250 |
236 |
184 |
198 |
250 |
|
|
SESAME |
|
550 |
650 |
650 |
570 |
|
|
COSSETTE DU MANIOC |
269 |
235 |
250 |
138 |
250 |
|
|
Source: DSID_2020 |
||||||
connectez-vous !
Connexion
Inscription
0 Commentaire
Lire aussi

UN REGARD SUR "GO AFRICA ONLINE"
Go Africa Online est une entreprise qui se donne pour mission de bâtir un réseau professionnel au cœur de l’Afrique et nourrit l’ambition d’être un réseau de communication incontournable. Cette entreprise propose un outil de communication fabuleux afin de répondre aux attentes du continent en matière de développement économique sur internet.
Go…

Cocktail à l’hôtel GHIS PALACE : A l’honneur, les fidèles clients et prestataires de services
Ce jeudi 22 janvier 2015, l’hôtel GHIS PALACE a accueilli dans son nouveau cadre rénové une soirée festive.
Après les traditionnelles présentations de vœux au travers de divers canaux : carte, SMS et appel téléphonique, la direction a convié ses clients (particuliers, responsables et chefs service de société) et ses prestataires de services à…

RELIKA : Solution de gestion de monnaie
RELIKA est la solution apportée au problème de monnaie auquel s’exposent souvent vendeur et client. Avec RELIKA, réclamez votre monnaie après une opération d’achat.
RELIKA est présente à la Foire MADE IN TOGO et vous propose son service de création et de gestion de compte de façon rapide et à très moindre coût. Vous avez la possibilité grâce au s…

« CHALLENGE STARTUPPER DE L’ANNEE»
« Challenge startupper de l’année» est un concours initié il y’a de cela trois ans par « Total Group », l’une des plus grandes compagnies de pétrole du monde. Ce concours vise à soutenir essentiellement les jeunes entrepreneurs dans divers domaines tels les énergies renouvelables et les Techniques de l’Information et de la Communication (TIC).
…

AGRICULTURE ET CORONAVIRUS/ LE TOGO DÉVOILE SON PLAN DE RIPOSTE
Dans le souci de consolider la sécurité alimentaire et nutritionnelle et améliorer le revenu des producteurs agricoles d’une part et d’autre part, faire de l’agriculture : un levier de création de richesses en cette période de crise sanitaire liée à la pandémie du coronavirus, le gouvernement togolais vient en aide aux protagonistes du secteur agr…

Harmonisation des prix chez TOGOCEL
Communiquez désormais en toute liberté vers tous les réseaux nationaux. A partir du 17 Mai 2016, avec Togocel, c’est un tarif unique pour tous, et une baisse pour chacun.


